How To Trace And profiling Your PHP Code Performance?
written on Jum 06 Desember 2013 by Habibillah
Problem
This morning I got problem that performance of my application going slowly. This case just occur at this moment, not before. The application just worked yesterday and the days before.
Well, It's just on development phase and it scared me. If the application has worst performance on development, how can I step forward to production?
Getting a Solution
Firstly, I check the error message. PHP and Apache log file to ensure there is a code failures that guide me to fix this problem. All show no error reported except just "Application timeout". When I have no clue what pieces of code going wrong and work unexpected, I have an idea: "It's time to profiling my code. Maybe there is unstopped loops that I don't know where it is."
So I going to ensure my PHP XDebug running well. Here PHP.ini configation for XDebug:
[xdebug]
xdebug.remote_enable = On
xdebug.profiler_enable = On
xdebug.profiler_enable_trigger = On
xdebug.profiler_output_name = callgrind.out.%t.%p
xdebug.profiler_output_dir = "C:/standalone-apps/wamp/tmp"
xdebug.var_display_max_depth = -1
xdebug.var_display_max_children = -1
xdebug.var_display_max_data = -1
xdebug.auto_profile = 1
And PHP Info show me that Xdebug module has loaded properly.
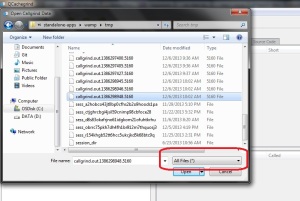
And now, I run my application. Once application started, Xdebug will provide files that show us the application performance. This is just text file so we can read it directly using text editor like notepad. However, I confuse to read the information, so I decide to read using Qcachegrind.
Just run qcachegrind.exe and select xdebug profiler output file as look like image below.
And... gotcha...
Look! QCachegrind show me that CI_log->write_log() method take most of all time.


